DATA MASTERY
FEATURED COURSE
Excel for Analysis & Reporting
- Power Query - Import and transform data.
- SUMIFS, COUNTIFS, AVERAGEIFS and IF
- XLOOKUP, INDEX/MATCH and lookup techniques
- Professional PivotTables & reporting
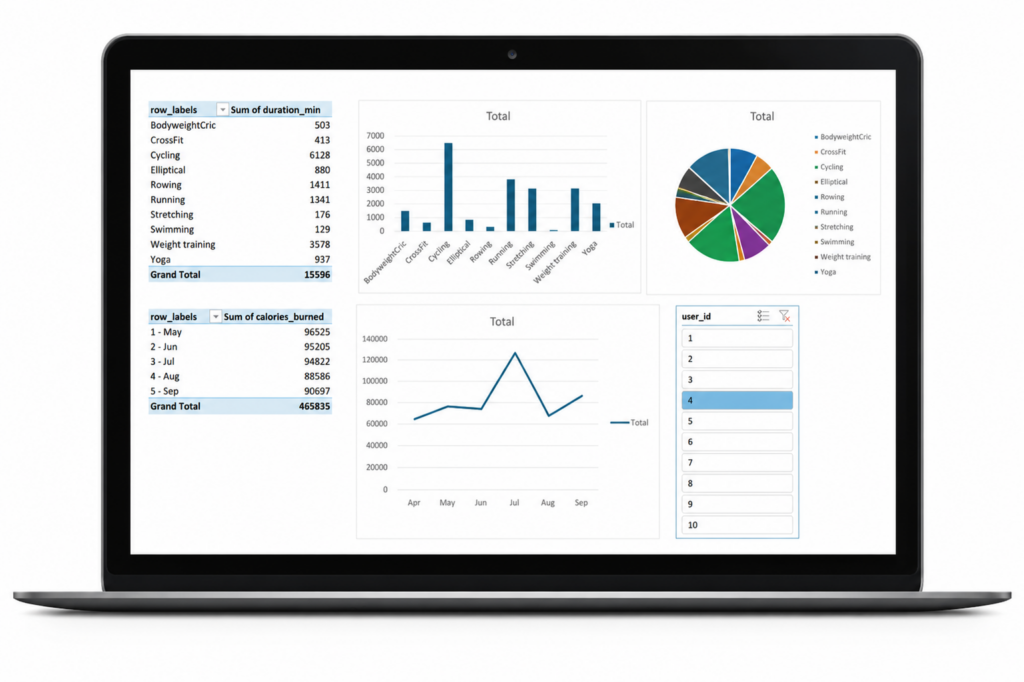
- Charts & dashboards
- Power Pivot and DAX
- And much more
A modular structure let you complete the full course or jump straight to the topics most relevant to you.
EARLY BIRD PRICE
£39.99
Why Learn Excel with Data Mastery?
Complete Excel Analysis & Reporting Workflow
Learn a complete professional workflow – from importing and transforming raw data through to powerful analysis, insightful dashboards and impactful reporting.
Structured Learning with Practice
Progress through 70+ professionally structured video lessons, supported by downloadable exercises, Q&A workbooks and fully worked solutions that reinforce every topic.
Learn your way
Study the course from start to finish with a structured learning pathway, or jump directly to the topics most relevent to your work with a flexible, modular course structure.
Who are Courses For?
Business Professionals
Master formulas, lookups, PivotTables and reporting techniques used every day in business.
Reporting & Data Professionals
Build professional reporting solutions using Power Query, Power Pivot and DAX.
Student & Career Changers
Develop practical Excel skills employers value, from fundamentals to advanced reporting.
Excel Users Ready to Go Beyond Basics
Take your Excel skills beyond the basics with LOOKUPs, PivotTables, Dynamic Arrays and advanced analysis techniques.
Skills You'll Build
Develop practical Excel skills used to import, analyse, visualise and report on data with confidence.
Data Loading & Structuring
- Power Query Fundamentals
- Excel Tables
- Named Ranges
- Structured References
- Data Preparation
Analysis & Reporting
- IF Statements
- SUMIFS, COUNTIFS & AVERAGEIFS
- XLOOKUP, VLOOKUP & INDEX/MATCH
- Date Intelligence Functions
- Dynamic Array Formulas
- Pivot Tables
Visualisation
- Professional Charts
- Conditional Formatting
- PivotCharts
- Dashboards
- Slicers & Timelines
Advanced Excel & BI
- Advanced PivotTables
- Power Pivot
- Data Models
- Relationships
- Measures
- Calculated Columns
- Calculate (DAX)
- Time Intelligence (MTD, YTD & Rolling Periods)