
Excel for Analysis & Reporting
Master the complete reporting & analysis workflow—from importing raw data through to professional dashboards and reporting.
- 70+ Structured Video Lessons
- Exercises & Fully Worked Solutions
- Learn at your own pace
- From Foundations to Advanced
Whether you’re looking for complete Excel mastery or targeted learning, the modular course structure lets you learn your way.
COURSE PRICE
£49.99
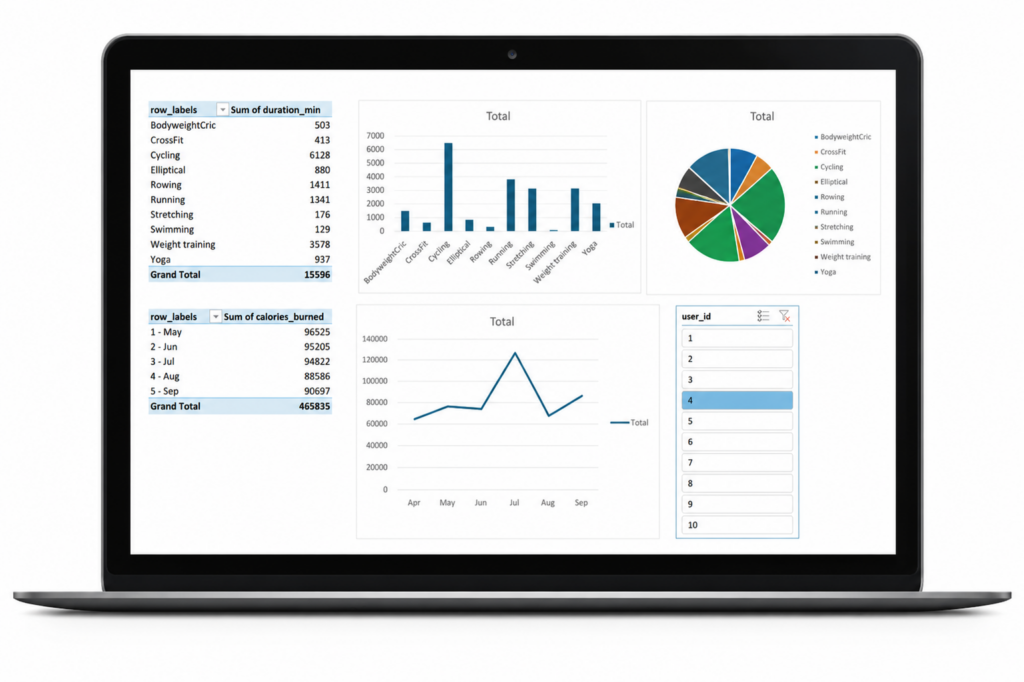
Your Learning
Follow the course from start to finish to master the complete Excel analysis & reporting workflow, or jump directly to the topics most relevant to your work
Excel Foundations
Master the core Excel skills used throughout the rest of the course.
Excel Analysis & Reporting
Build practical reporting skills using fotmulas, tables and real-world business scenarios.
Pivot Tables
Learn to summarise, analyse and explore large datasets with PivotTables and PivotCharts.
Charts & Visualisations
Create clear, professional charts that communicate insights effectively.
Advanced Excel
Create clear, professional charts that communicate insights effectively.
Power Query, Power Pivot & DAX
Transform data, build data models and create powerful calculations with DAX.
Course Curriculum
Excel Foundations
- Excel Fundamentals
- Excel Tables
- Structured References
- Named Ranges
- Data Validation
Excel Analysis & Reporting
- IF Statements
- Aggregate Functions - SUMIFS, COUNTIFS, AVERAGEIFS
- LOOKUPS - XLOOKUPS, VLOOKUPS, INDEX / MATCH
- Time Intelligence - Date Functions
- Logical Functions
- Full Reporting Tables Vs Interaxctive Reports
- Conditional Formatting Techniques
Pivot Tables
- Creating PivotTables
- Groupings & Calculations
- Slicers & Timelines
- Pivot Charts
- Interactive Reporting
Charts & Visualisation
- Charts Foundations - Columns Charts, Line Charts
- Multiple Axis, Multiple Series
- Scatter Charts
- Histograms
- Waterfall
- Pie Charts / Donut Chart
- Dynamic Charts with Slicers
- Dynamic Dropdown Charts
Advanced Excel
- Dynamic Arrays
- FILTER
- SORT
- UNIQUE
- Array Formulas
- Strong use cases
Power Query, Power Pivot & DAX
- Power Query Fundamentals
- Relationships
- Calculated Columns
- Measures
- Calculate Function
- Filter Function
- ALL & ALLSELECTED
- Time Intelligence Reporting - Pivot Table MTD, YTD, Rolling & Comparison
Why Learn with Data Mastery?
70+ Structured Video Lessons
Learn through professionally structured lessons that build from Excel fundamentals to advanced analysis, reporting, Power Query, Power Pivot and DAX.
Downloadable Exercises & Fully Worked Solutions
Reinforce every topic with practical exercises, Q&A workbooks and fully worked solutions so you can apply what you’ve learned with confidence.
Structured Learning Journey
Follow the course from start to finish with each module building naturally on the previous one, creating a complete Excel reporting workflow.
Learn Your Way
Jump directly to the topics you need or complete the entire course sequentially—ideal whether you’re filling skill gaps or mastering Excel from the ground up.
Who is this Course For?
Business Professionals
Master formulas, lookups, PivotTables and reporting techniques used every day in business.
Reporting & Data Professionals
Build professional reporting solutions using Power Query, Power Pivot and DAX.
Student & Career Changers
Develop practical Excel skills employers value, from fundamentals to advanced reporting.
Excel Users Ready to Go Beyond Basics
Take your Excel skills beyond the basics with LOOKUPs, PivotTables, Dynamic Arrays and advanced analysis techniques.
Ready to Take Your Excel Skills to the Next Level?
Whether you’re looking to improve your Excel skills for work, prepare for a new role or strengthen your analysis and reporting capabilities, this course provides a structured yet flexible learning experience—from Excel fundamentals through to advanced techniques.
Course Price
£49.99
- Lifetime Access
- 70+ Structured Video Lessons
- Donwloadable Exercises & Solutions
- Learn at your own pace
Frequently Asked Questions
Here are answers to some of the most common questions about the course.
Is this course suitable for beginners?
Yes. The course starts with Excel fundamentals before progressing through analysis, reporting, PivotTables, Power Query, Power Pivot and DAX.
What is included with the course?
The course includes over 70 structured video lessons, downloadable exercise files, worked solutions and supplementary Q&A workbooks designed to reinforce each topic.
Do I need Microsoft 365?
Microsoft 365 is recommended to ensure access to the latest Excel features covered throughout the course.
What are the system requirements?
The course is designed and demonstrated using Microsoft Excel for Windows. While many concepts will also apply to Excel for Mac, some features and functionality—particularly Power Query, Power Pivot and certain keyboard shortcuts—may differ or be unavailable. For the best learning experience, I recommend using the latest version of Microsoft Excel for Windows.
Can I complete the course at my own pace?
Yes. Learn at your own pace by working through the modules sequentially or jump directly to the topics most relevant to you.
Will I receive future course updates?
Yes. Future improvements and updates to the course are included with your purchase.
Who is this course designed for?
The course is designed for business professionals, analysts, students and anyone looking to develop practical Excel skills for analysis and reporting.
Stay Updated!
Practical Excel and Power BI tips, analysis and reporting insights, plus occasional course updates and exclusive offers
Welcome!
You have successfully joined our newsletter.